
If you’ve ever tried to hunt down a mysterious PHP error on a live WordPress site, you know the drill: scrolling through an endless debug.log file, squinting at timestamps, and hoping you spot the right line before you lose your mind. LiKoToN Debug Logs was built to put an end to that.
It’s a lightweight, modern plugin that automatically collects logs from multiple sources at once and displays them in a clean, filterable viewer – right inside your WordPress dashboard.
What does it log?
- PHP errors and warnings: including critical errors, deprecations, and parse errors
- WordPress errors (
wp_error_added) - REST API requests: route, method, and parameters
- User login events
- Custom logs you add yourself via
Likoton_Debug_Logs_Logger::log()
The plugin supports the full range of PSR-3 log levels plus extended PHP-specific levels: debug, info, notice, warning, error, critical, alert, emergency, deprecated, user_deprecated, strict, parse, core_error, core_warning, compile_error, compile_warning, recoverable_error, user_error, user_warning, user_notice.
A logs viewer that’s actually pleasant to use
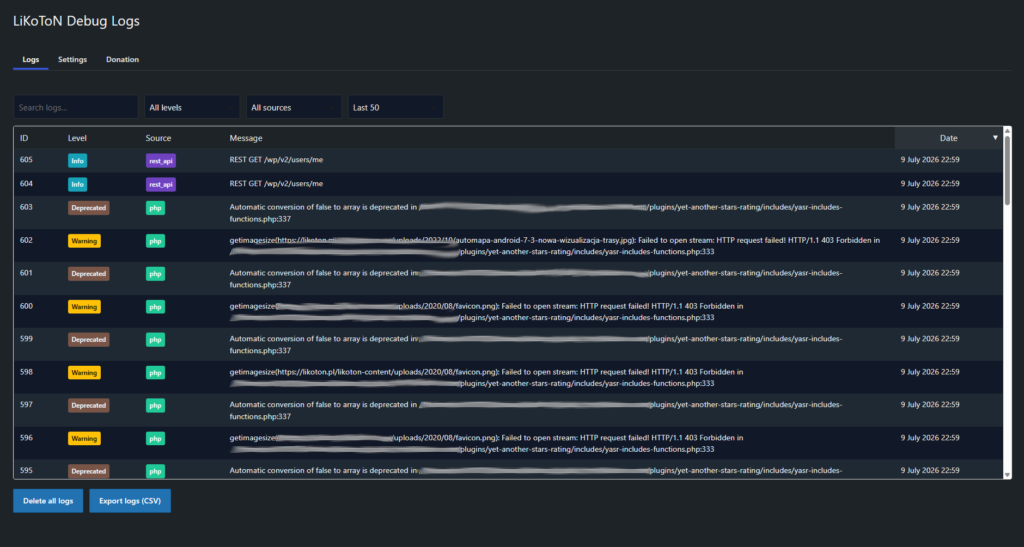
The heart of the plugin is its logs viewer:
- Live AJAX filtering – no page reloads
- Infinite scroll instead of clunky pagination
- Client-side sorting
- Filters for search text, level, source, and “last X logs”
- Color-coded badges so you can spot severity at a glance
- Responsive table that holds up on smaller screens too
Dark mode
The plugin ships with a WordPress 7-style dark mode toggle that applies across all of its admin pages, a nice touch for late-night debugging sessions.
CSV export
Export all your logs to CSV with a single click. Each row includes both created_at_utc and created_at_local timestamps, and the export is protected by a nonce and a capability check.
Automatic cleanup
Logs can pile up fast, so LiKoToN Debug Logs uses WP-Cron to automatically prune old entries based on a configurable retention period, anywhere from 30 minutes to a full month, and optimizes the database table along the way.
Settings that fit your workflow
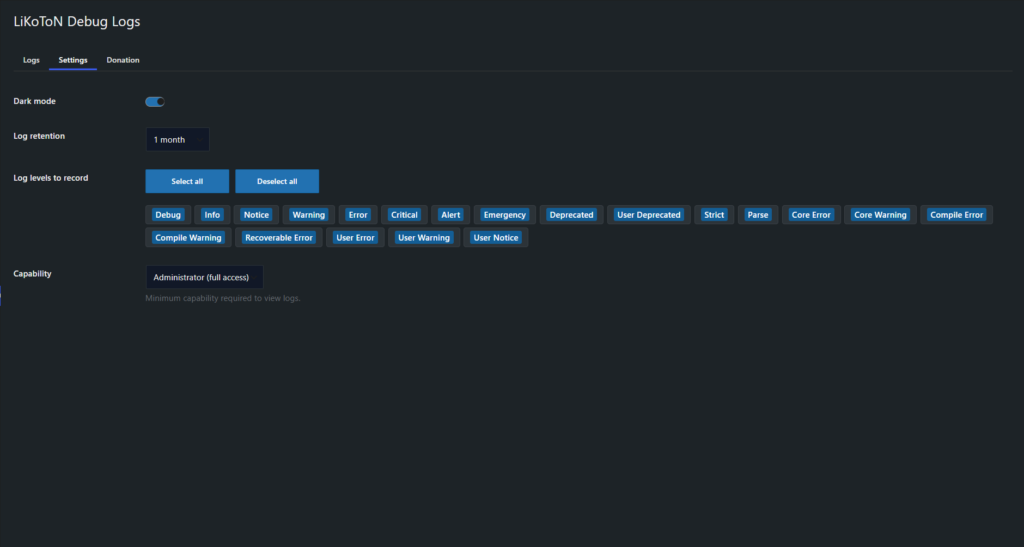
From the settings screen you can:
- toggle dark mode on or off,
- set the log retention period,
- choose which capability is required to view logs,
- pick which log levels are visible in the viewer,
- rely on auto-save via AJAX with a toast notification confirming the change.
Built for developers
The plugin exposes a simple API for logging your own custom events straight from your code:
Likoton_Debug_Logs_Logger::log( 'info', 'custom_source', 'Something happened', [ 'extra' => 'data' ] );That makes it easy to hook your own logging logic into themes or other plugins without building a logging system from scratch.
Multisite ready
The plugin fully supports multisite installs. Every site in the network gets its own independent logs table.
Security and performance
Logs are stored in a dedicated database table, so writes are fast and don’t slow down your site. Access to the log viewer can be restricted to a specific capability, and the CSV export is protected with a nonce check.
Wrapping up
LiKoToN Debug Logs is built for developers and site administrators who want a fast, clear window into what’s happening under the hood of WordPress, without manually digging through log files.
Try the plugin: wordpress.org/plugins/likoton-debug-logs
Source code on GitHub: github.com/likot180/likoton-debug-logs